SMS OTP Latency: How to Set Useful Alert Thresholds
A practical guide to breaking down SMS OTP latency by stage, choosing metrics and observation windows, and creating alerts that detect anomalies without mistaking a DLR for confirmation of receipt.
Why Average Latency Is Not Enough to Monitor OTPs
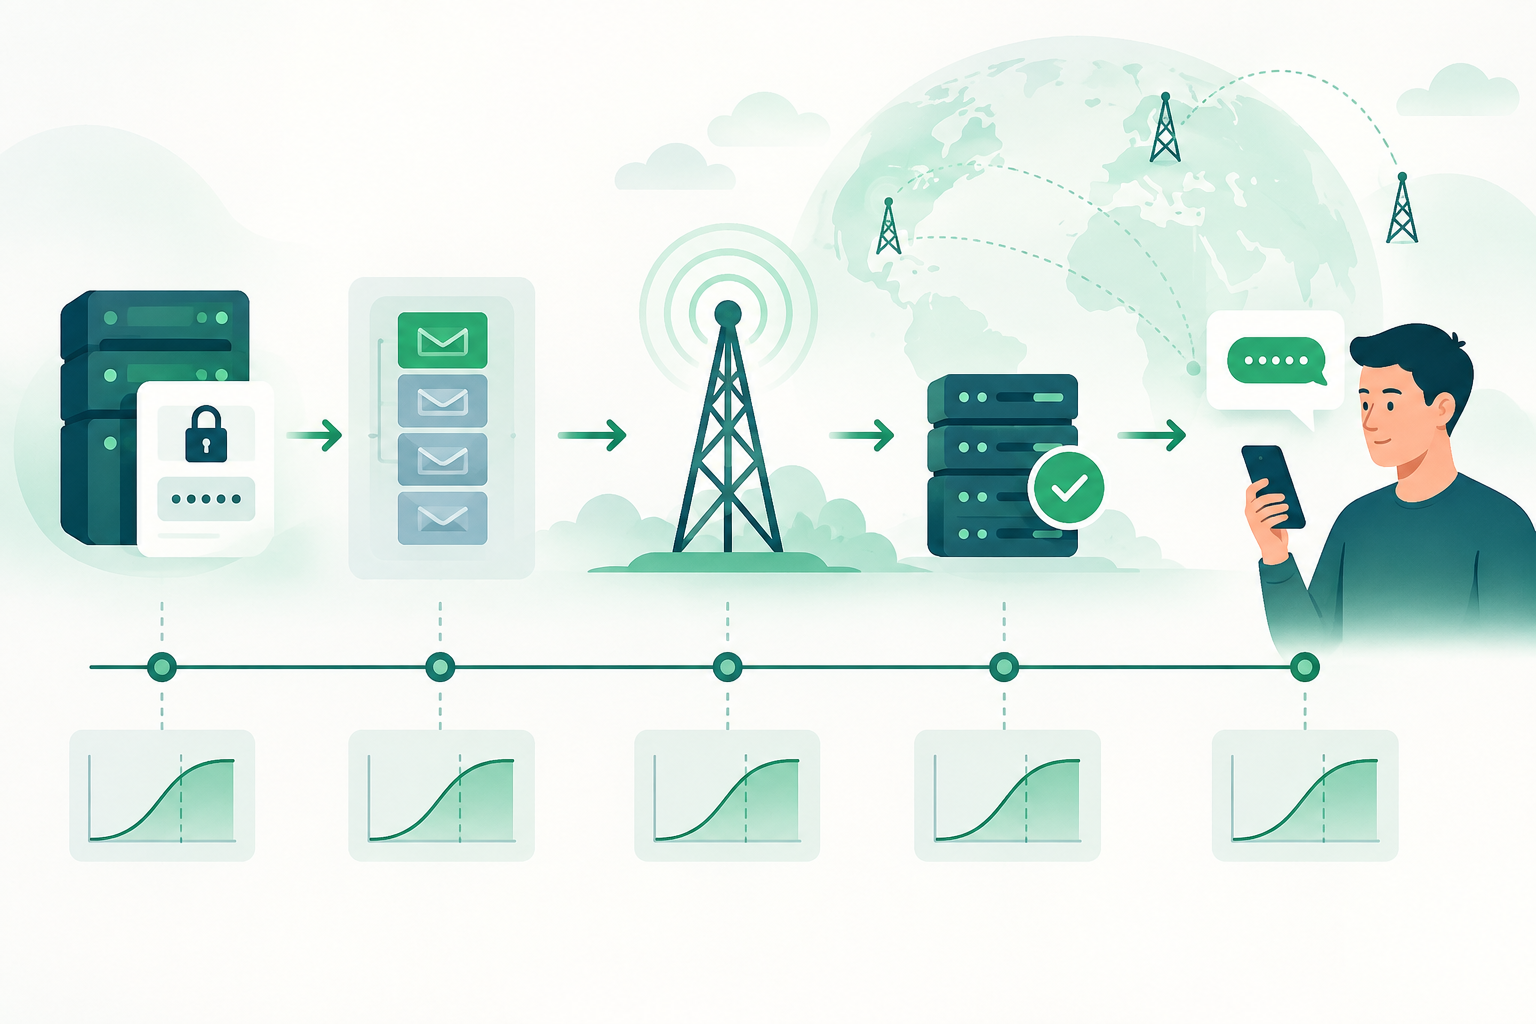
The average summarizes the whole dataset, but it can hide a much slower tail of messages that affects some sessions. That is why OTP monitoring should look at the distribution of times rather than rely on a single average.
Percentiles help answer different questions: the median describes the center of the distribution; a high percentile helps show the experience of slower cases without allowing a few extreme values to dominate the metric. The available evidence does not establish a universal percentile that works for every application, destination, or route.
Before setting an alert, define which event marks the start and which marks the end. If components use different timestamps or criteria, comparisons may reflect measurement differences rather than a real change in service.
- Keep the average as a complementary indicator, not the only signal.
- Compare percentiles using the same calculation method and the same start and end definitions.
- Interpret each percentile alongside the observation count: a small sample can produce unstable results.

Map the OTP Journey and Assign a Budget for Each Stage
A total time only tells you how much time passed between two selected events. To locate delays, break down the journey using your own timestamps: code generation, queue entry and wait, provider submission, and arrival of a reported status. Also record when the application receives a provider response, if that event is part of your integration.
Not all platforms expose the same events, and the time between stages may include internal processing, waiting, or communication latency. Document what each interval measures and which components it excludes. Avoid adding overlapping durations or comparing clocks that are not adequately synchronized.
A stage budget is an operational target you define, not a universal technical limit or a delivery guarantee. Start with product requirements and data observed under normal conditions; allocate the available time across stages you can measure and control. Review the allocation when the architecture, integration, or observed behavior changes.
- Define start and end events for each interval.
- Identify which team or component can act on each stage.
- Record cases without complete timestamps as incomplete data instead of assigning them an invented duration.
- Do not use an internal target as a promise to users or a delivery guarantee.
Choose Percentiles, Sample Volume, and Observation Windows
Choose metrics based on the decisions they need to support. The median can show typical behavior; a high percentile can flag degradation in the slower tail. Monitor both when useful, alongside sample volume and the share of events without a result. Do not present a figure as representative when there are few observations.
An observation window should balance speed and stability. A short window can react quickly, but may also amplify random variation; a longer window smooths fluctuations, though it can take more time to reveal a change. The choice depends on volume, traffic patterns, and how quickly the team needs to act; the available evidence does not establish a recommended duration.
If you use dynamic thresholds, validate how the tool learns and adjusts before relying on its alerts. Microsoft's Azure Monitor documentation states that its dynamic thresholds use ten days of historical data when a rule is created. This behavior applies to that specific feature and should not be treated as a general rule for other systems.
- Record the percentile, window, minimum volume applied, and how incomplete data is handled.
- Check that a window contains enough events for the metric to be interpretable in your context.
- Assess whether a change is sustained and relevant before treating a brief variation as an incident.
Separate Submission Latency, DLR Receipt, and User Confirmation
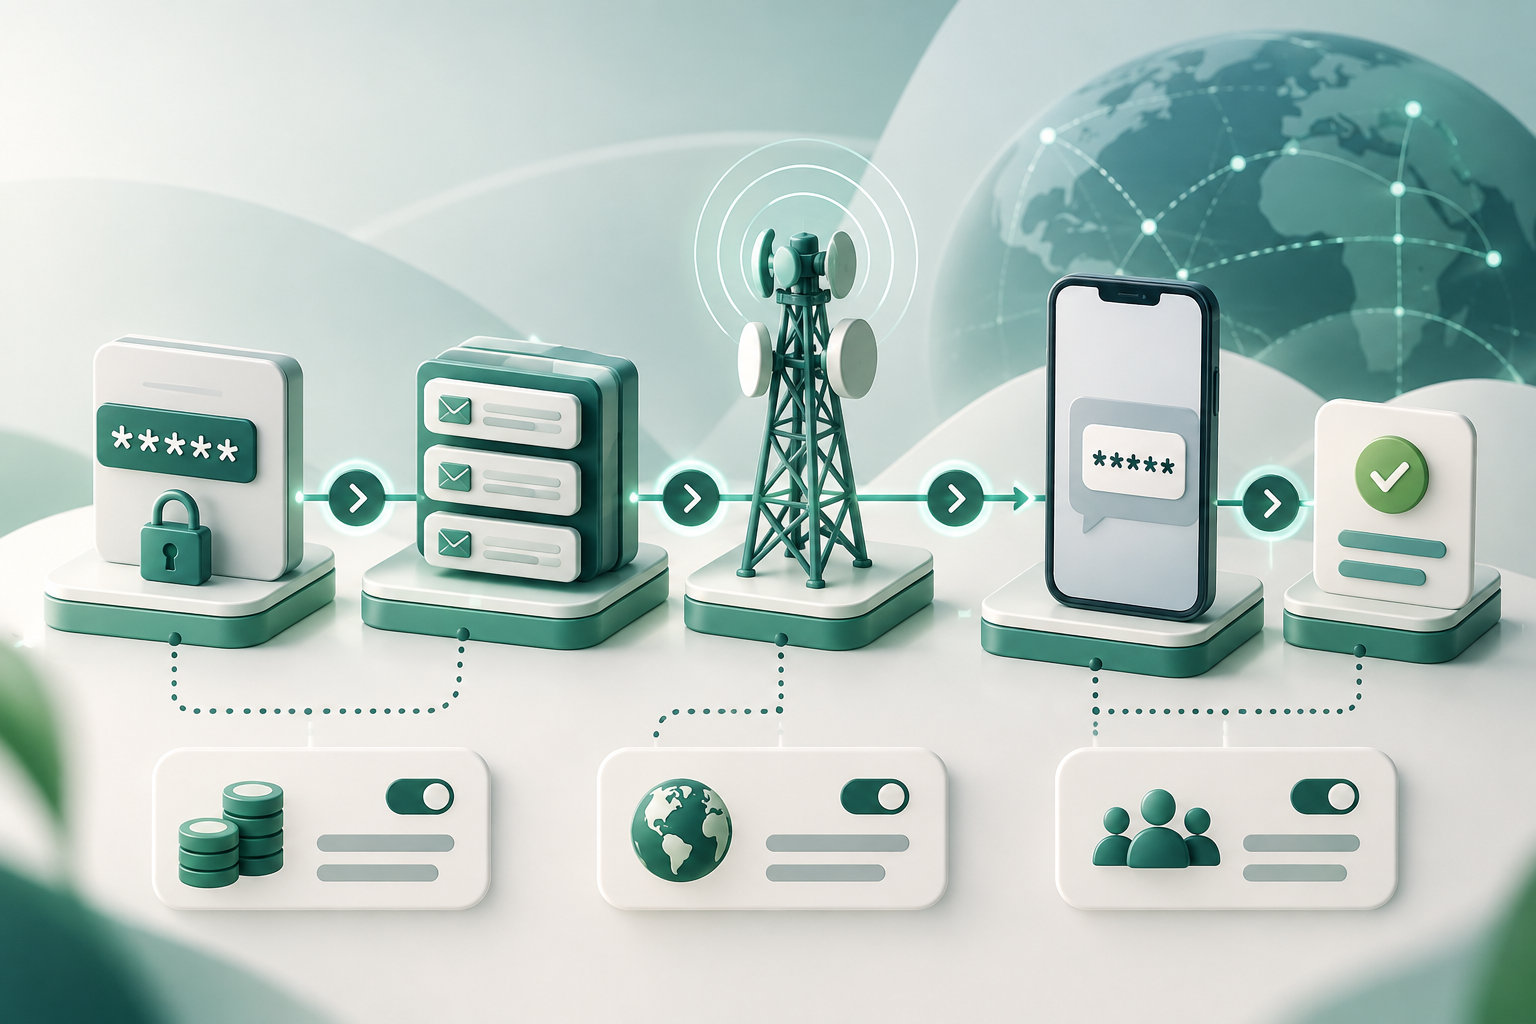
Separate milestones in your metrics. A response to a submission request, a subsequent status reported by the messaging chain, and confirmation in the application are distinct events. Measure each with its own timestamp and label it explicitly.
A DLR is a status reported by a component in the messaging chain. Its precise meaning depends on the implementation and the status communicated. Do not present it, on its own, as independent proof that the SMS appeared on the device or that the person read it.
If the user enters the code, that event may confirm that the authentication flow progressed, but it does not automatically amount to a pure delivery measurement: user action and other application steps may affect it. Keep the technical reported-status indicator separate from the outcome observed in the product.
- Label accepted submission, reported status, and authentication flow completion separately.
- Document the meaning of statuses for the specific integration; do not generalize codes across implementations.
- When independent device-level confirmation is unavailable, state that uncertainty in reports.
Set Thresholds by Destination and Context Without Turning Them into Guarantees
An aggregate threshold can hide different behavior in part of the traffic. When volume and data allow, compare relevant groups, such as destination or route, and retain a global view to detect broad impacts. Use consistent, documented destination identifiers; the segmentation plan should reflect what your system actually observes.
Over-segmentation creates groups with too few samples and unstable readings. Keep an aggregate category when there is not enough data for a cautious conclusion, and avoid attributing a cause to an operator or route just because a metric changed at the same time.
Thresholds describe when to investigate a deviation from an internal target or baseline. They do not prove that a message will be delivered before a deadline or that a route will produce the same result for every user or session.
- Start with dimensions that enable a concrete operational action.
- Show data volume and coverage alongside each comparison.
- Do not publish results as market benchmarks if they come from internal measurements or non-comparable samples.
Design Alerts with Persistence, Minimum Volume, and Severity
An actionable alert combines a metric, a condition, a window, and enough volume to interpret it. Choose these elements using data from your own service and the operational response time available; there are no verified universal values for setting them.
To avoid notifications for isolated variations, you can require the condition to persist or recur across multiple evaluations. Adjust persistence based on impact and the risk of delaying a response. Separate latency degradation signals from missing reported statuses or integration failures: they require different diagnostics.
Assign severity based on observed impact and the ability to act, not only on how far a metric is from its reference. An investigation alert can call for reviewing an anomaly; reserve escalation for conditions the team has defined as relevant to the service.
- Include the stage, percentile, window, volume, and affected groups in the alert.
- Define who investigates and what evidence they should review before escalating.
- Test rule behavior against historical or simulated data when possible, without assuming that testing guarantees future performance.
Investigate an Alert: Compare Stages, Destinations, and Statuses
First check that the change did not result from an instrumentation change, clocks, volume, or inclusion criteria. Then compare durations by stage with the total: if the delay is concentrated in one stage, focus the investigation on the components that control it without treating a cause as proven.
Compare the global view with destination or route groups that have interpretable samples. Review reported statuses and cases without a status separately, because a delay in receiving a DLR does not by itself prove that submission was also delayed.
Record the affected interval, observed groups, recent changes, and data limitations. If the evidence does not distinguish between possible causes, describe the conclusion as a hypothesis pending verification.
- First validate data integrity, volume, and timestamp consistency.
- Locate the interval where the deviation appears before assigning a cause.
- Compare groups only when their data is sufficient and comparable.
- Distinguish missing status, status latency, and latency measured at other stages.
Review Thresholds and Document Uncertainty
Thresholds need review when the product, instrumentation, traffic pattern, or operating conditions change. Keep a change history and explain what evidence prompted each adjustment. Avoid changing a rule just to silence an alert without first checking whether the signal reveals a real change.
Record exclusions, incomplete events, low-volume dimensions, and the limits of what each status can claim. This information helps readers interpret trends cautiously and prevents an internal measure from being mistaken for an external guarantee.
BulkSMSMarket describes a platform in development for discovering, comparing, buying, selling, and managing A2P SMS capacity, as well as an internal testing platform that observes, among other things, latency and DLR consistency. Public numerical cards are illustrative until connected to contractual data; they should not be used as live commercial metrics or reference thresholds.
- Save the metric definition, current rule, exclusions, and review date.
- Reassess the threshold after relevant changes and verify that the comparison remains valid.
- Clearly state what is observed data, what is an internal target, and what uncertainty remains.
Frequently asked questions
Which percentile should I use to alert on SMS OTP latency?
There is no universally supported percentile for all services. Choose the metric based on the experience you want to monitor and validate its stability against the available volume. The median and a high percentile can provide complementary perspectives.
How long should the observation window be?
It depends on volume, traffic patterns, and the response time your operation needs. A short window reacts sooner but may be more sensitive to variation; a long one smooths fluctuations but can delay detection. There is no verified universal duration.
Does a DLR confirm that the OTP reached the phone?
Not on its own. A DLR is a status reported by the messaging chain, and its meaning depends on the implementation. It does not necessarily equal independent verification of receipt on the device or confirm that the user read the message.
Should I create separate thresholds by destination or route?
This can help if segmentation makes a difference easier to investigate and there is enough comparable data. If groups are small, their metrics may be unstable; retain an aggregate view and state the uncertainty.
Do alert thresholds guarantee OTP delivery?
No. They are operational controls for flagging deviations in defined metrics. They do not guarantee delivery, receipt within a specific time, or the same outcome for every message.
Sources consulted
- Azure Monitor: umbrales dinámicosMicrosoft Learn
- Especificaciones 3GPP3GPP
- ITU-T E.164International Telecommunication Union
- NIST SP 800-63-4NIST
- OWASP Authentication Cheat SheetOWASP
- GSMA: redes y tecnologíasGSMA